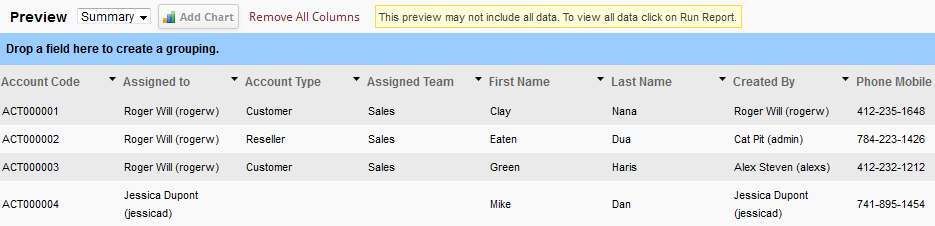
If you select Summary Preview, then the list looks like:
Add Chart
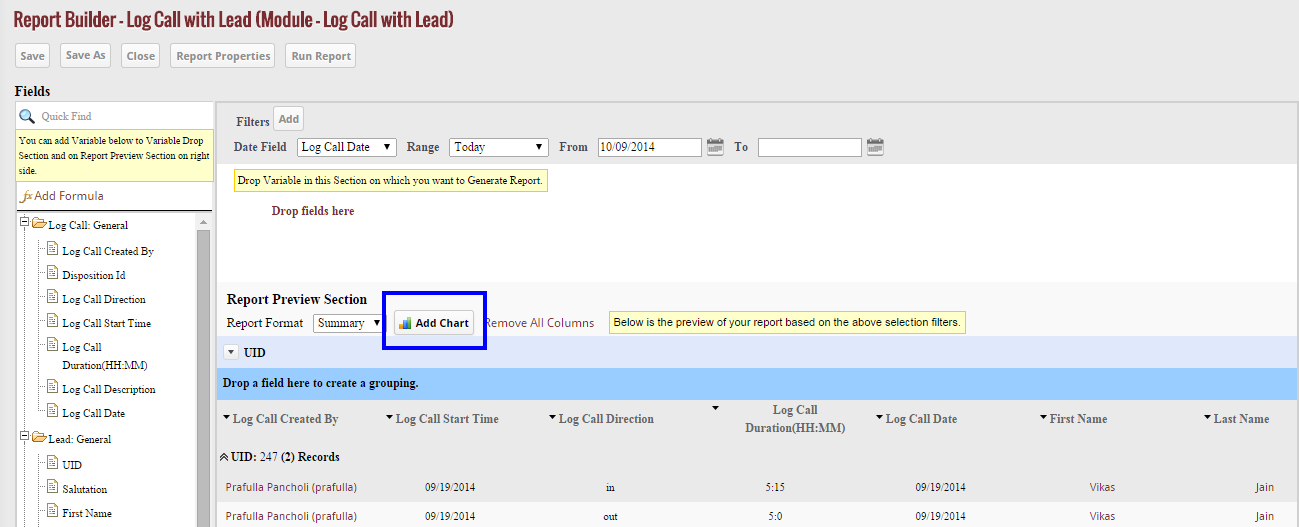
In summary view of the report, you can also add chart in the report. But before adding chart you have to create grouping of fields. To create grouping, drag the fields from the list of the fields and drop it to the report section. After creating grouping, click on “Add Chart” Option.
When you click on “Add Chart” Option, a new page appears in which you have to insert the details of the chart. The details include:
1. Type of chart: You have to select the type of the chart from the list of chart that include Horizontal Bar Chart, Vertical Bar Chart, Line Chart, Pie Chart, Donut Chart and Funnel Chart.
2. X-axis: X-axis is the record count of the report you want to show in chart.
3. Y-axis: Y-axis is your selected field that you want to show in chart.
4. Chart Title: You have to write the name of the chart you want to give.
5. Show Axis label: Select yes if you want to show the label of the axis in chart else select no.
6. Enable Hover: When you take the point of your mouse to the chart then it display the name of the particular part, this is called Hover. If you wish to enable Hover, then select yes, else no.
7. Chart position: Select the position of the chart i.e. if you wish to place the chart above the report, then select “above report”, and if you wish to place the chart below the report, then select “below report”.
8. Chart size: You can also define the size of the chart. The size includes tiny, small, medium, large and extra-large.
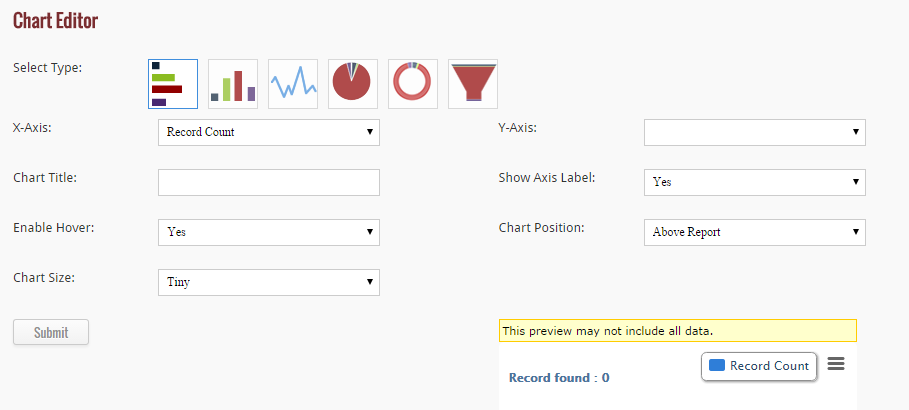
After inserting and selecting all the details of the chart, you can view the preview of the chart below the details. If the chart is just the same you want, then click on “Submit” button to save the chart.